Monday, 8 AM. Alice, the value stream architect at consulting company CC, came into the home-office room, opened her laptop, and started checking her schedule. In an hour, she would have an important meeting, the occasion as desired as terrifying. For the first time, she would run the dynamic value stream mapping workshop to advise a small engineering organization SEO of 50 people on how to improve its efficiency.
That engineering organization had been building a software product for enterprises. Bob, the VP of engineering, recently joined the company and was looking for a third-party opinion on how to accelerate delivery. He had a sense of what needed to be changed; however, he needed to show tangible numbers from the improvement to justify the required investment into delivery harness tools and tech debt reduction. Alice knew Bob’s pain point, so she embraced dynamic value stream mapping instead of the classical one. She needed to explore the dynamic behavior of the value stream and verify the hypothesis of what would be if Bob were to make a particular change. What would be the impact on the speed of delivery? To run such a workshop, she invited critical people from several teams: Product owner, Development lead, QA lead, infrastructure lead, and release manager.

A how-to workshop
After the introduction and ice-breaker, Alice proceeded with capturing the value stream structure. Questions asked at the beginning: what are the operating units? And what steps should an operating unit go through to be considered a delivered value increment provided to users?
In the case of software development, Alice chose to stay on a feature level. And this is what she captured.

First of all, a feature had to be designed, and then once a design was ready, developers proceeded with coding. Then, a pull request was created to verify a feature code through automated code tests. If the tests were passed, then a senior engineer reviewed the feature’s code. If no issues were found, the feature was deployed into the development environment to do a quick verification. The implemented features were accumulated, then a test team deployed them into the test environment for verification. If the tests were passed, then a release team took the last verified build and moved it into production, and if there were no issues identified during the deployment, the feature was exposed to customers.
Once Alice captured the structure, she needed to clarify the behavior of every element. The first one on the value stream map was a generator; so she asked How often does a new feature request come into the value stream?
The product owner had difficulty providing a precise number, though he suggested that it would be roughly from 5 to 10 features per week. This information allowed Alice to specify generator behavior in the dynamic value stream map. After that, Alice started reviewing the steps of the process one by one. The questions asked for all elements were fairly similar.
What is the nature of a step - continuous or cyclical? Continuous means that it works whenever there is an operating unit available for work. Cyclical takes operating items periodically - once a week, once a day, etc.
Alice learned that product owners released a features backlog once in two weeks since the development sprint was two weeks. So, Alice marked the design phase as a cyclical process with a 10-day cycle time. All steps involved in the feature implementation (code, pull request, code review, and development environment verification) were continuous since engineers took them individually. However, the implemented features accumulated in the development environment for 2 weeks since test engineers worked in 10-day cycles. The release team took a verified build and moved it into production once a month; therefore, the cycle time for deployment was 20 days.
How long did it take to process an operating unit?
When Alice asked such a question, people struggled to provide a specific number; they thought they would be able to outline the range. To simplify, Alice assumed the uniform distribution of the processing time; she knew that later she could revise the distribution.
In each step, how many people are in each role?
Alice reflected on the role name and participation percentage for each step. For example, for the code step, two roles of equal participation were needed to work on an operating unit – back-end engineer and front-end engineer. And she captured the number of people available in a role in the field, "Count", which kept track of the capacity.
What is the distribution of step outcome?
When several exits existed, Alice clarified their distribution. In the case of any engineering process, many backward loops led to the code step, so Alice walked through all steps generating such backward loops. In contrast to the classical value stream map, when a percent of complete and accurate items is captured without specification where incorrect items go, the dynamic value stream map specifies steps receiving such a rework.
What are the priorities of steps with multiple inputs?
As with any engineering process, the code step had many inputs: from the design step where the backlog features were coming to various validation steps where rework might come. In the code step, it is essential to reflect the prioritization according to which these items should be processed. Alice clarified that the engineering team prioritized a defect above a new feature. So, Alice specified all rework priority with number 1 and new features from the design step with number 2.
To finalize the dynamic value stream mapping workshop, Alice decided to clarify the details of the queues between steps.
Do you have any interim required for a feature to wait between steps?
The engineering team confirmed that it was not the case.
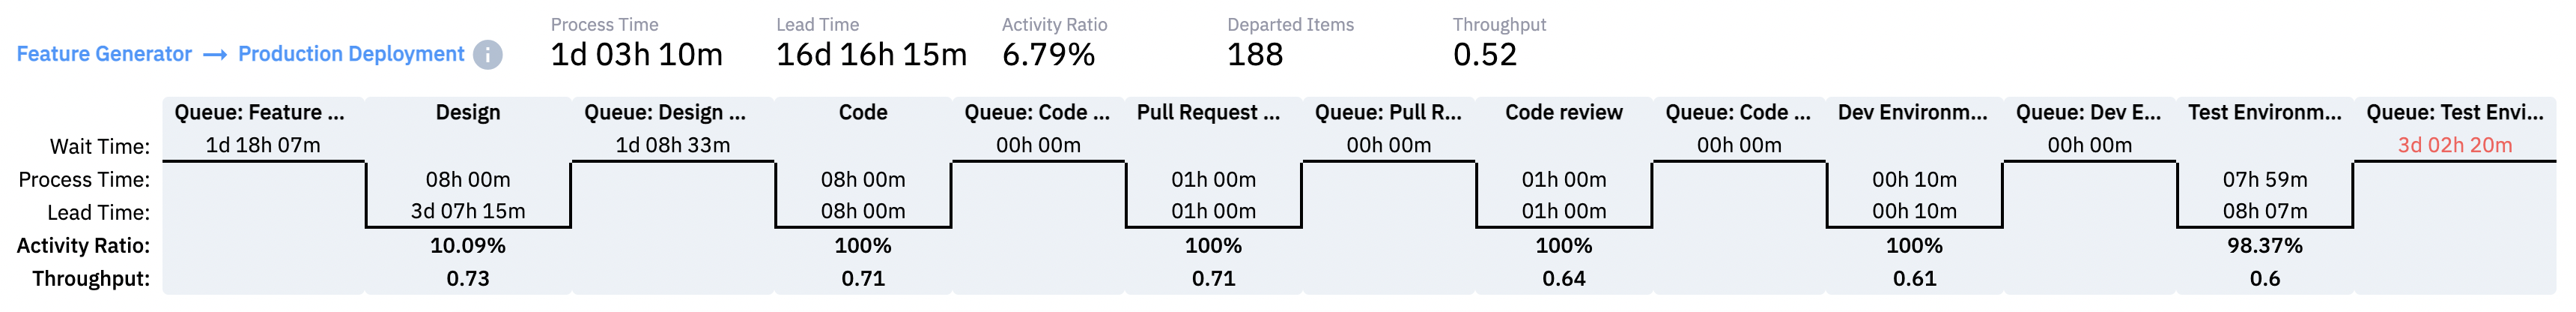
The final point of the workshop was to make sure the model reflected the correct behavior of the system. To do that Alice ran the simulation and clarified with the team whether the process performance and the lead time structure were close to reality.